
Sentek Drill & Drop Series: Data Interpretation
This publication series provides information and recommendations pertaining to the Sentek Drill & Drop, a multisensor capacitance probe commonly used in Mississippi for scheduling irrigation. Other publications discuss other types of soil moisture sensors. Users should choose tools that best fit their needs.
Introduction
Soil moisture measurements by the Drill & Drop probe are often reported in terms of volumetric water content (VWC). Expressed as a percentage or as a decimal fraction, VWC identifies how much of the soil volume is occupied by water. Suppose a soil sample of 10 cubic inches contained 3 cubic inches of water. The VWC of this sample would be 30%, 0.3 in3/in3 (cubic inches of water per cubic inch of soil), or 0.3 inch/inch (inches of water per inch of soil).
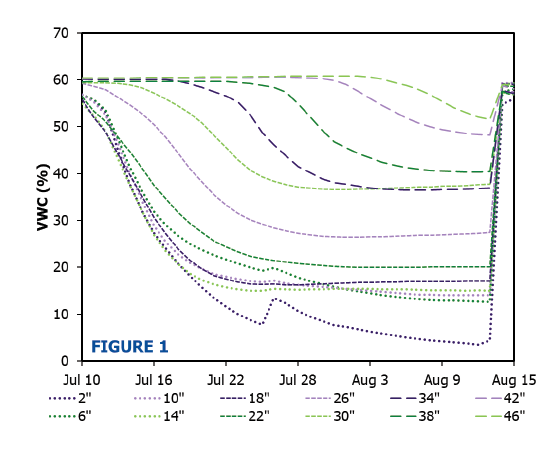
The VWC of a soil increases with wetting and decreases with drying. Figure 1 shows the VWC at twelve depths as reported by Drill & Drop probes in a Sharkey soil near Stoneville, Mississippi. The soil started wet and dried gradually over 5 weeks with minimal rain and no irrigation while the soybean crop progressed from early R3 to late R5 growth stage. A 0.3-inch rain on July 25 moistened the topsoil slightly, but the root zone was not refilled until 3.4 inches of rain fell on August 13. This example dataset will be used to illustrate four methods of interpreting the depth-by-depth Drill & Drop data for scheduling irrigation.
Profile Volumetric Water Content
The profile VWC can be calculated by averaging the VWC across multiple depths. The range of depths to include in this average might be specified by independent knowledge of root water uptake or be determined by sensor detection of which depths are/had been experiencing root water uptake. In Figure 1, the maximum depth of root water uptake appeared to increase from 26 inches to beyond 46 inches.
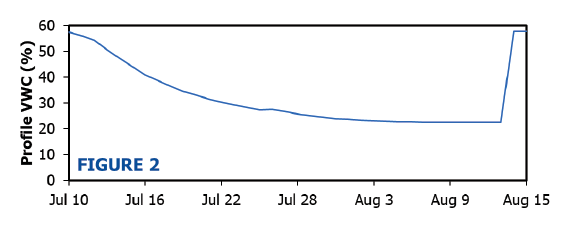
Profile VWC increases with wetting and decreases with drying. Figure 2 shows the profile VWC across the top 40 inches for the example dataset. One way to schedule irrigation is to wait until profile VWC becomes lower than the selected trigger.
Profile Depletion
Depletion is the difference between the current VWC and the full (but not excessive) VWC level (also known as “field capacity”). In Figure 1, the full VWC level was around 59%. The profile depletion can be calculated by averaging the depletion across multiple depths. The range of depths to include in this average should be chosen based on root water uptake, just like for profile VWC as explained in the previous section.
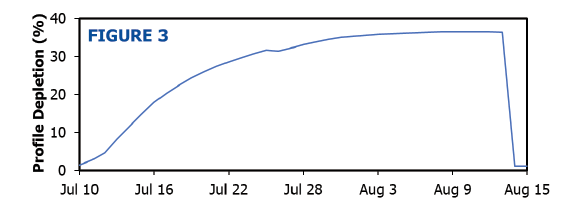
Profile depletion decreases with wetting and increases with drying. Figure 3 shows the profile depletion across the top 40 inches for the example dataset. One way to schedule irrigation is to wait until profile depletion becomes higher than the selected trigger.
Rate of Profile Depletion
The rate of profile depletion is the increase in profile depletion during a day with no rain and no irrigation. Over a period with steady weather and crop canopy conditions, a reduced rate of profile depletion would suggest that the crop is not getting enough water from the soil (at least immediately around the probe). To normalize the effect of significant changes in weather or canopy, the sensor-observed rate of profile depletion on each day can be divided by a model-expected rate of profile depletion on the same day.
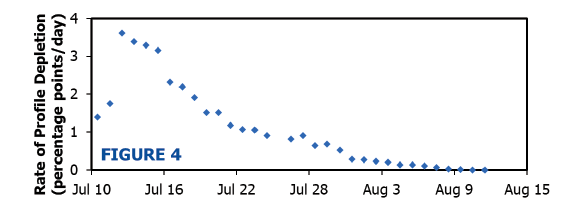
Figure 4 shows the (unnormalized) rate of profile depletion across the top 40 inches for the example dataset. The rate of profile depletion reached its peak on July 12 (the third day of drying) and then hovered around a plateau before dropping sharply from July 16 (the seventh day of drying) onwards. One way to schedule irrigation is to wait until the rate of profile depletion descends from its plateau and becomes lower than the selected trigger.
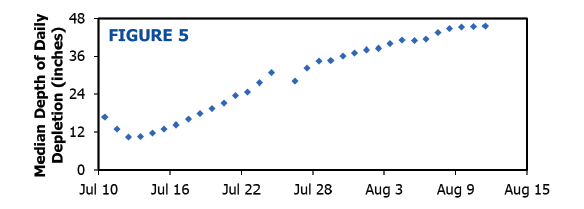
Median Depth of Daily Depletion
The median depth of daily depletion represents the center depth of root water uptake. Half of the daily increase in depletion occurs above the median depth of daily depletion, while the other half occurs below it. Even after the crop completes the development of its root system, the median depth of daily depletion is not constant but instead fluctuates in response to soil moisture distribution. When soil moisture is abundant throughout the root zone, root water uptake tends to be concentrated at shallow depths. Thus, the median depth of daily depletion would be relatively shallow. When easily extractable water has been exhausted at shallower depths but remains available at deeper depths, root water uptake tends to migrate downward. Thus, the median depth of daily depletion would be relatively deep. Both trends can be seen in Figure 1.
Figure 5 shows the median depth of daily depletion for the example dataset. The median depth of daily depletion reached its minimum on July 12 (the third day of drying) and then increased with further drying. One way to schedule irrigation is to wait until the median depth of daily depletion rises from its minimum and becomes larger than the selected trigger.
Conclusion
Although multiple methods exist for interpreting Drill & Drop data, the methods differ in reliability to indicate optimal irrigation timing across diverse scenarios on Mississippi row-crop farms. Research is being conducted to assess the reliability of various methods and to establish appropriate triggers for the most reliable method(s). The resultant findings will be presented in future publications.
For more information, please contact Extension Irrigation Specialist Drew Gholson (drew.gholson@msstate.edu).
This publication is a contribution of the National Center for Alluvial Aquifer Research (NCAAR), the Mississippi State University Extension Service, and the Row-Crop Irrigation Science Extension and Research (RISER) initiative. NCAAR is supported by the Agricultural Research Service, United States Department of Agriculture, under Cooperative Agreement number 58-6066-2-023. RISER is supported jointly by the Mississippi Soybean Promotion Board, Mississippi Corn Promotion Board, Mississippi Rice Promotion Board, Cotton Incorporated, and Mississippi Peanut Promotion Board.
The information given here is for educational purposes only. References to commercial products, trade names, or suppliers are made with the understanding that no endorsement is implied and that no discrimination against other products or suppliers is intended.
Publication 3898 (POD-05-23)
By Himmy Lo, PhD, Assistant Extension/Research Professor; Jacob Rix, Extension/Research Associate I; and Drew Gholson, PhD, Assistant Professor, Delta Research and Extension Center.

The Mississippi State University Extension Service is working to ensure all web content is accessible to all users. If you need assistance accessing any of our content, please email the webteam or call 662-325-2262.