
Cut Flower Production: Overview for Mississippi
Industry Overview in the U.S.
Cut flower production can be a viable business venture for small farms due to the increasing demand for local products and a lack of access to flowers that do not ship well long distances (Ford et al. 2012). In a recently released study by the United States Department of Agriculture (2019), floriculture crops are valued at $4.63 billion wholesale, a 6 percent increase from 2015. The number of floriculture producers has increased by approximately 8 percent. Another measure is found in the Association of Specialty Cut Flower Growers membership. In 2017, new membership increased by 3 percent; in 2018, it increased by 46 percent. In the past 5 years, membership has grown 116 percent (ASCFG 2019).
Though farms consisting of less than 5 acres of production and less than $10,000 in sales are not recorded in National Agricultural Statistics Service reports, small-scale production is a growing trend with a supplemental income potential that could be viable for scale operations. For operations that have sales greater than $100,000, the current wholesale value of cut flowers is estimated to be $375 million (USDA 2019). California is the top-producing state in U.S. floriculture, accounting for 26 percent of the total wholesale value of crops. Florida ranks second with 20 percent, Michigan is next with 10 percent, and New Jersey and Ohio tie for fourth at 5 percent. These states have a variety of attributes, including climate, market accessibility, established farms, and infrastructure (USDA 2019).
The U.S. imported $1.31 billion worth of flowers in 2019, the majority (60 percent) from Colombia at $789.6 million. Other top exporters were Ecuador at $266.5 million (20 percent) and The Netherlands at $78 million (6 percent). Major shipping destinations for these imports were Miami International Airport (78 percent), Los Angeles International Airport (4.3 percent), and John F. Kennedy International Airport in New York (3.8 percent) (U.S. Trade Numbers 2019).
Those considering floriculture production must assess potential buyers ahead of planting and production, determine the price sensitivity of these buyers, and determine what types of products potential buyers would be interested in purchasing. Market outlets for cut flowers include caterers, restaurants, farmers’ markets, grocery stores, party planners, wedding venues, and wholesale and retail florists.
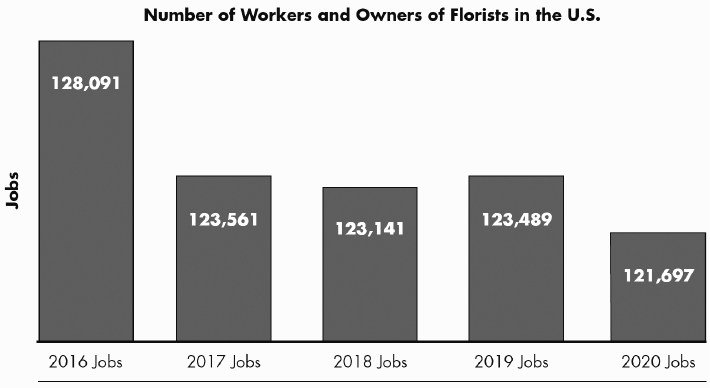
The florist industry is represented by North American Industry Classification System (NAICS) Code 453110. This industry “comprises of establishments known as florists primarily engaged in retailing cut flowers, floral arrangements, and potted plants purchased from others. These establishments usually prepare the arrangements they sell” (NAICS 2020). The national florist industry employed an average of 123,996 workers and owners of commercial nurseries from 2016 to 2020. However, the number of jobs created by the sector continued to decrease during the entire period (Figure 1). The combined wages, salaries, and proprietor earnings of all the QCEW employees, non-QCEW employees, self-employed, and extended proprietors in the U.S. averaged $22,930 per year from 2014 to 2018 (EMSI 2020).
Industry Overview in Mississippi
Statewide data sources such as ArcGIS Software by Esri were reviewed to determine information about the cut flower industry in Mississippi due to the lack of information in the NASS report. These sources do not report cut flower sales, but aggregate data within the greenhouse, nursery, floriculture, and florist retail industry. A survey of current producers is recommended in order to attempt to determine retail or wholesale sales numbers.
According to the 2013 estimates made by Hodges et al. (2015), the industry accounted for $47 million in sales contribution and 565 in job creation. This article also reported that florists made a $60 million sales contribution and generated 1,463 jobs. According to ESRI’s Retail Market Place Profile Report, florists in Mississippi have approximately $65,277,539 in retail sales. An estimated $6,287,219 is drawn from outside the state, which can be attributed to sales to out-of-state customers buying flowers in Mississippi.
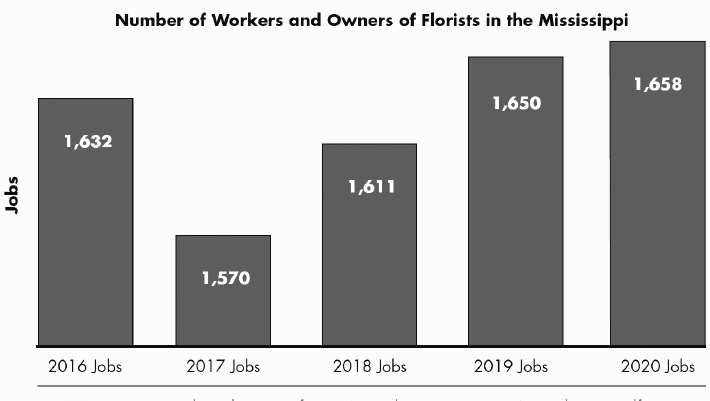
In Mississippi, the number of jobs in the industry averaged 1,624 from 2016 to 2020 (Figure 2), representing about 1.3 percent of the national industry. Lower combined wages, salaries, and proprietor earnings were observed in Mississippi, averaging $18,521 per year during the past 5 years, which was about 81 percent of the national average for the industry.
The 2020 industrial overview released by EMSI (2020) showed that 16 percent of workers and owners in Mississippi were male. About 84 percent of the workers and owners were female. In the United States, 24 percent of them were males, and 76 percent were females.
The recently industrial overview released by EMSI (2020) showed that workers and owners in Mississippi averaged 52 years of age. About 20 percent of the workers and owners are 65 and older; 32 percent, 55 to 64; 21 percent, 45 to 54; 15 percent, 35 to 44; and 13 percent, under 35.
In the United States, the workers and owners averaged 50 years of age. Around 17 percent of the workers and owners are 65 and older; 31 percent, 55 to 64 years; 21 percent, 45 to 54; 14 percent, 35 to 44; and 18 percent, under 35.
The newly released industrial overview (EMSI 2020) also categorized workers and owners by race or ethnicity. More than 81 percent of the workers and owners in Mississippi are White, followed by Hispanic or Latino (10 percent). The remaining workers and owners are Black or African American (4 percent), Asian (3 percent), and two or more races (2 percent).
In the United States, more than 76 percent of the workers and owners are White. Hispanic or Latino made up more than 14 percent. The rest consisted of Black or African American (4 percent), Asian (3 percent), and two or more races (3 percent).
Before growing commercial cut flowers, consider these questions:
- What types of products are in demand in your area—cut flowers, cut greenery, value-added products? This could be determined by meeting with wholesalers, retailers, and consumers in your area to determine their needs.
- What can you produce to coincide with seasonal demand?
- What retail market are you seeking to reach—for example, retail florists, wholesale florists, or farmers’ markets?
- Is your market diversified? For example, will you be selling to retailers, wholesalers, and direct customers such as farmers’ market attendees?
- How can you add value to your product? Some examples are mixed bunches, making wreaths from dried flowers, or floral-design events on your farm.
- How will you build relationships with your potential clients? Approaches include social media, delivering sample products, and inviting retailers to your farm.
- Are you selling an experience or convenience, or are you trying to compete on price? Price competitions are challenging for small-scale producers.
References
Association of Specialty Cut Flower Growers (ASCFG). August 2019.
ArcGIS Software by Esri. Business Analyst Online.
EMSI. 2020. Economic Modeling Specialist International.
Ford, T., L. Kime, J. Harper, and S. Bogash. May 2012. Cut Flower Production. Penn State Extension.
Hodges et al. 2015. Economic Contributions of the Green Industry in the United States in 2013. HortTechnology, 25(6): 805-814.
IMPLAN Group, LLC. IMPLAN 2013. Huntersville, NC.
NAICS. 2020. North American Industry Classification System.
United States Department of Agriculture, National Agricultural Statistics Service (USDA-NASS). May 2019. Floriculture Crops 2018 Summary.
U.S. Trade Numbers. March 2019. Imports: fresh cut flowers.
Publication 3495 (POD-08-23)
By Rachael Carter, PhD, Extension Instructor, Extension Center for Government and Community Development; James DelPrince, PhD, Assistant Extension Professor, Coastal Research and Extension Center; and Benedict Posadas, PhD, Associate Extension/Research Professor, Coastal R&E Center.

The Mississippi State University Extension Service is working to ensure all web content is accessible to all users. If you need assistance accessing any of our content, please email the webteam or call 662-325-2262.
Select Your County Office
Authors


